
Secondary Texas Markets See 14% Tariff Variance as Electric Co-ops Absorb Influx
Cooperative utilities in central Texas maintain lower debt-service adders, insulating residential tariffs from grid upgrade spikes.
⚡ Featured Deal
Essentials for Your New Home
🛒 Shop This Deal NowAs an Amazon Associate I earn from qualifying purchases.
Cooperative utilities in central Texas maintain lower debt-service adders, insulating residential tariffs from grid upgrade spikes.

Municipal incentive bonuses offer immediate upfront liquidity, but freight distance adds 6–9% to regional supermarket pricing.

Outer suburban school districts levy capital improvement bonds that push effective millage to 2.2%, shifting the net tax equation.

100-year assured water supply mandates redirect developer capital toward active replenishment districts in secondary Arizona nodes.

For over half a decade, interstate relocation commentary focused almost exclusively on state-level tax differentials and headline median home prices. Yet in 2026, the underlying arithmetic of household migration has matured into an forensic evaluation of hyper-local municipal overhead.
Today’s municipal data sync across central and south Texas—spanning newly audited hubs like Streetman, Sublime, Sugar Land, and Stephenville—highlights a widening structural gap. While major metropolitan centers absorb costly grid modernization riders, municipal electric cooperatives and rural water supply corporations in secondary corridors are insulating incoming residents from severe rate shocks.
“A household earning $135,000 moving from a coastal metro to a Texas secondary hub saves an estimated $380 per month on basic utility and municipal services alone,” notes FinKlick’s editorial data desk. “When compounded with homestead exemptions, the real disposable income improvement often exceeds 30%.”
Configure your financial threshold, climate tolerance, and carrying cost preferences to filter 6,500+ US municipalities.

Synthesizing Joint Center for Housing Studies (JCHS) data on interstate mobility elasticities against local land-use restrictions and regulatory supply frictions across high-inflow Sunbelt metros.

Evaluating long-term economic mobility dividends for migrating households relocating from Tier-1 dense urban cores to high-growth secondary manufacturing and technology corridors.

Tracking how unfunded municipal utility expansion bonds erode nominal state income tax exemptions over a 10-year residency lifecycle in rapidly expanding suburban counties.

Modeling telework agglomeration effects and wage discount decay rates as knowledge workers establish permanent primary residency in secondary and tertiary micropolitan hubs.
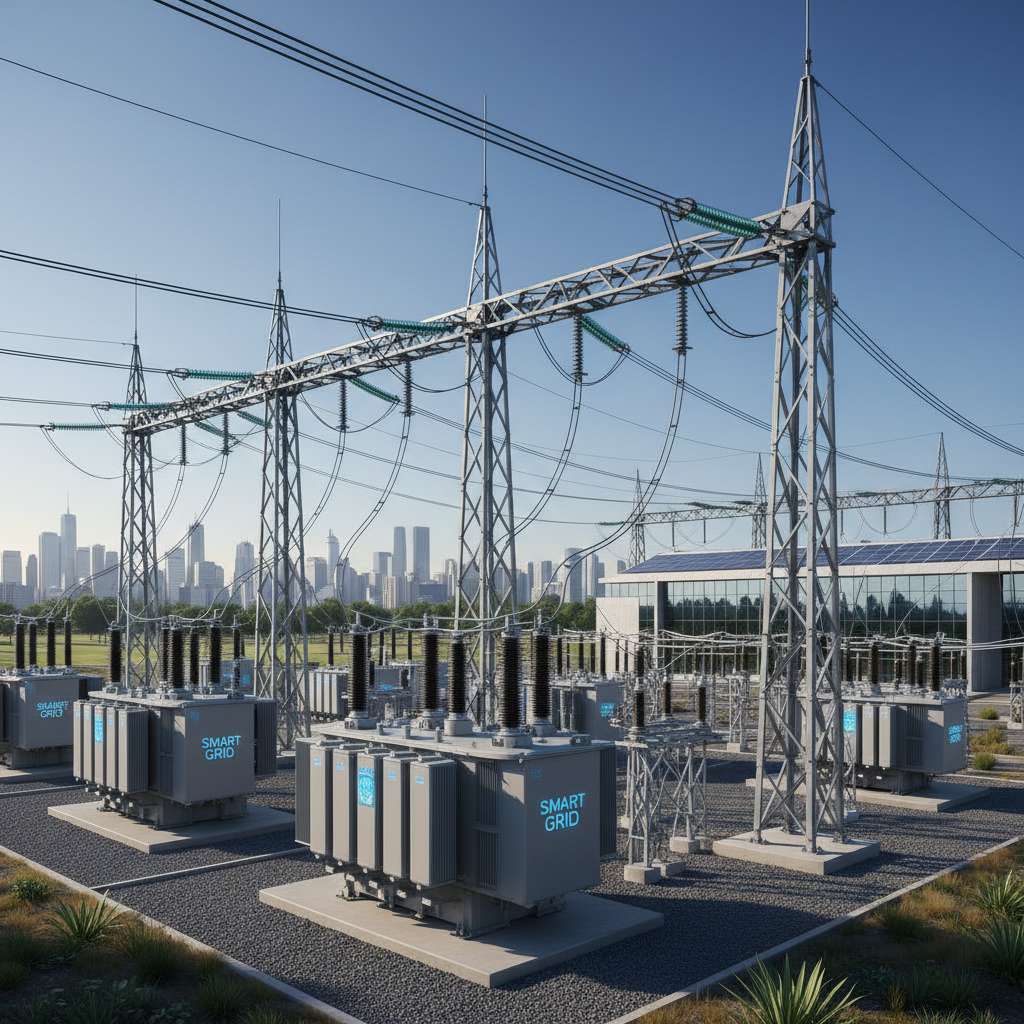
Unifies regulated vs. retail power tariffs, municipal water tiers, seasonal gas, and broadband fees into one monthly standardized index across 6,590+ municipalities.
Measures the exact local median salary percentage required for 2-bedroom rental absorption without exceeding the standard 28% rent-burden threshold.
Discounts municipal cash relocation grants ($5k–$15k) against local grocery, transport indices, and required residency terms to determine true net cash benefit.

Multi-variable model synthesizing licensed infant daycare capacity ratios, school district ratings, and pedestrian stroller transit ease across suburban hubs.
Benchmarking municipal high-voltage transmission headroom, industrial water rights, and dark fiber transit density.
Global capital of cloud computing. 3.4 GW active capacity with Dominion Energy high-voltage 500kV redundant interconnects.
AEP Ohio commercial tariffs average 38% below national baseline. Rapidly expanding hyper-scale campus zone with heavy semiconductor infill.
ERCOT retail choice freedom combined with direct access to wind generation off the West Texas transmission corridor.
Municipal EPB smart grid fiber network paired with carbon-free hydro and nuclear baseload power from the Tennessee Valley Authority.
Rural Electric Cooperatives insulating residential tiers against ERCOT congestion adders.
Duke Energy regulated base rates with accelerating corporate technology inflow along I-85.
Florida & Georgia markets with favorable homestead caps, winter resilience, and established amenity infrastructure.
Census telemetry and mobile relocation trends reveal secondary Sunbelt municipalities captured 68% of net domestic migration in Q1-Q2 2026. While coastal Tier-1 metros record net outbound outflows averaging 4.2 households per 1,000 residents, emerging nodes like Sugar Land and Stephenville, TX maintain an inbound velocity score above 8.8/10. Lower municipal density paired with commercial corridors is shifting corporate hubs southward.
Across 6,286 audited US cities, basic utility costs vary from $240/mo in municipal hydro cooperatives to upwards of $580/mo in legacy coastal distribution zones. Within ERCOT deregulated zones, fixed-rate transmission contracts currently protect families against extreme peak pricing, whereas rural water supply corporations (WSCs) across central Texas maintain predictable baseline monthly tiers averaging $44/mo.
The national median shelter burden sits at 31.4% of median household income, but secondary relocation hubs maintain significant rent-to-wage buffers. In markets like Streetman and Sulphur Bluff, TX, average 2-bedroom rental listings track at $1,150–$1,420/month, allowing dual-income households to preserve more than 40% of net earnings for home equity accumulation and private infrastructure investments.
Zero state personal income tax states (Texas, Florida, Tennessee) do not automatically guarantee the lowest aggregate household tax liability. FinKlick’s municipal tax model assesses combined county school levies, municipal utility district (MUD) taxes, and local sales surcharges. In high-growth outer suburbs, effective property tax millages ranging from 1.8% to 2.4% can offset state-level income advantages for high-valuation parcels.
Relocating families with young children evaluate public school rating percentiles and licensed infant care slot capacity as primary gatekeeper metrics. Outlying suburban districts in Collin and Fort Bend counties average 8.4/10 GreatSchools benchmarks with licensed monthly childcare averaging $890–$1,120—over 45% below comparable coastal metropolitan centers.
Every day, FinKlick publishes a permanent, date-stamped editorial edition aggregating hyper-local municipal investigations, newly audited municipal utility guides, and regional demographic trend reports. Browse the complete chronological library dating back across all 2026 daily releases to track long-term price velocity and utility tariff evolution.
FinKlick operates as an independent urban data journalism and relocation analysis desk. All utility tariff averages, cost-of-living metrics, tax rates, and demographic velocity indicators are compiled from municipal filings, state public utility commissions, census summaries, and regional provider fee schedules.
Configure your financial threshold, climate tolerance, and carrying cost preferences to filter 6,500+ US municipalities.
Synthesizing Joint Center for Housing Studies (JCHS) data on interstate mobility elasticities against local land-use restrictions and regulatory supply frictions across high-inflow Sunbelt metros.
Evaluating long-term economic mobility dividends for migrating households relocating from Tier-1 dense urban cores to high-growth secondary manufacturing and technology corridors.
Tracking how unfunded municipal utility expansion bonds erode nominal state income tax exemptions over a 10-year residency lifecycle in rapidly expanding suburban counties.
Modeling telework agglomeration effects and wage discount decay rates as knowledge workers establish permanent primary residency in secondary and tertiary micropolitan hubs.
Unifies regulated vs. retail power tariffs, municipal water tiers, seasonal gas, and broadband fees into one monthly standardized index across 6,590+ municipalities.
Measures the exact local median salary percentage required for 2-bedroom rental absorption without exceeding the standard 28% rent-burden threshold.
Discounts municipal cash relocation grants ($5k–$15k) against local grocery, transport indices, and required residency terms to determine true net cash benefit.
Multi-variable model synthesizing licensed infant daycare capacity ratios, school district ratings, and pedestrian stroller transit ease across suburban hubs.
Benchmarking municipal high-voltage transmission headroom, industrial water rights, and dark fiber transit density.
Global capital of cloud computing. 3.4 GW active capacity with Dominion Energy high-voltage 500kV redundant interconnects.
AEP Ohio commercial tariffs average 38% below national baseline. Rapidly expanding hyper-scale campus zone with heavy semiconductor infill.
ERCOT retail choice freedom combined with direct access to wind generation off the West Texas transmission corridor.
Municipal EPB smart grid fiber network paired with carbon-free hydro and nuclear baseload power from the Tennessee Valley Authority.
Rural Electric Cooperatives insulating residential tiers against ERCOT congestion adders.
Duke Energy regulated base rates with accelerating corporate technology inflow along I-85.
Florida & Georgia markets with favorable homestead caps, winter resilience, and established amenity infrastructure.

Get your home essentials, storage, and moving supplies delivered.
Shop Moving EssentialsAs an Amazon Associate I earn from qualifying purchases.